Commodity prices across the board are surging amid the Fed’s easy-money policies and a skyrocketing monetary supply. Will gold soon catch the wave?
Key Takeaways:
-
- Gold is desperately trying to break through $1,800 after a beautiful double bounce on the key $1,680 support level. Investors are anticipating a robust continuation of gold’s third great bull market.
- The equity markets seem to be largely ignoring the frightening statistics regarding money supply growth and ballooning government and household debt. As a percentage of GDP, asset prices have now dwarfed previous cycle peaks in 2000 and 2007.
- The Fed’s accommodative policies are putting pressure on the U.S. dollar, which has lost nearly all its 2021 gains. Rising commodities prices are signaling a major drop in the currency’s purchasing power.
The Fed, the White House, and the world’s favorite precious metal
Gold is currently sitting around $1,765 following yesterday’s FOMC meeting, in which Federal Reserve Chairman Jerome Powell reiterated the Fed’s commitment to “keep interest rates near zero,” maintain “sizable asset purchases,” and deliver “powerful support to the economy until the recovery is complete.” In other words, the money will keep flowing.
The U.S. economy’s robust but uneven recovery can be attributed to record fiscal and monetary spending measures from the White House and the Federal Reserve. The government powerhouses have come together to push the battered economy out of COVID-19 using whatever means necessary.
Since early 2020, total assets on the Fed’s balance sheet have jumped from just over $4 trillion to $7.8 trillion. The Fed increases its total assets by purchasing bonds (such as mortgage-backed securities) from the U.S. treasury. This process increases the money supply. The Biden administration’s massive spending proposals, such as the $4 trillion infrastructure bill, also require record monetary creation.
Are we approaching an inflection point?
No doubt these measures have worked. However, the recent surge in commodity prices and rising Consumer/Producer Price Indexes are generating some fear that dangerously high inflation could be on the horizon. Here are a few other mind-boggling data points that show where all the government’s printed money has ended up:
-
- M2 money supply in the United States has reached a 27% year-over-year growth rate this year, from under $16 trillion to nearly $20 trillion. To put that in perspective, Fed records show the M2 growth rate has been under 15% for the last 50 years (until 2020 of course).
- Debt securities (bonds and other interest-bearing assets) are currently sitting at 251% of GDP, and total securities (both debt and equities) have reached 551% of GDP. As a percentage of GDP, asset prices have far outpaced previous cycle peaks in 2000 and 2007.
- Household net worth just reached 606% of GDP. Previous cycle peaks were 492% in 2007 and 446% in early 2000.
- Investors poured over $500 billion into the stock market over the last five months. This exceeds stock market inflows over the previous 12 years combined.
These stats should cause every stock market investor to stop and think. Fortunately for gold investors, these inflationary pressures will likely provide a strong base for gold’s superior performance over the coming years. The precious metal sits comfortably in its third great bull market, which has already delivered impressive returns since its breakout in early 2019.
Gold holding steady
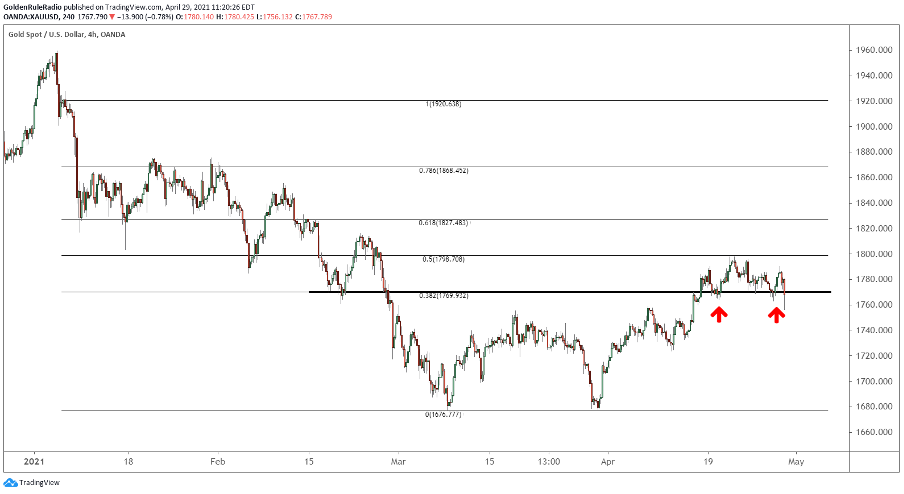
Gold has stayed mostly staying flat from last week, bouncing between the short-term .382 fib and the 50% correction line. The metal is trying to break above $1,800, which would be a strong confirmation that we are resuming the long-term bull market.
We would like to see gold rise confidently above $1,800 before confirming that the short-term bearish trend is over. While gold could experience another pullback, these discounted buying opportunities are unlikely to last much longer. If the price does start to rise above $1,800, you will want to have already entered the market.
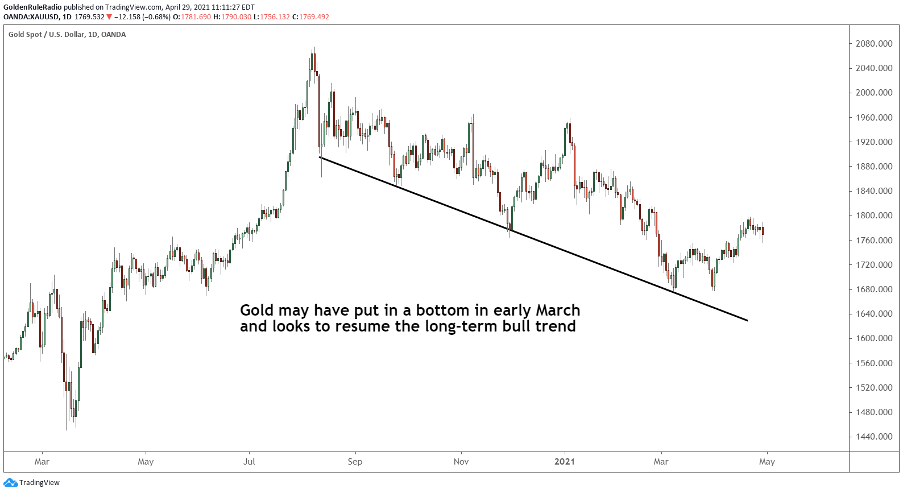
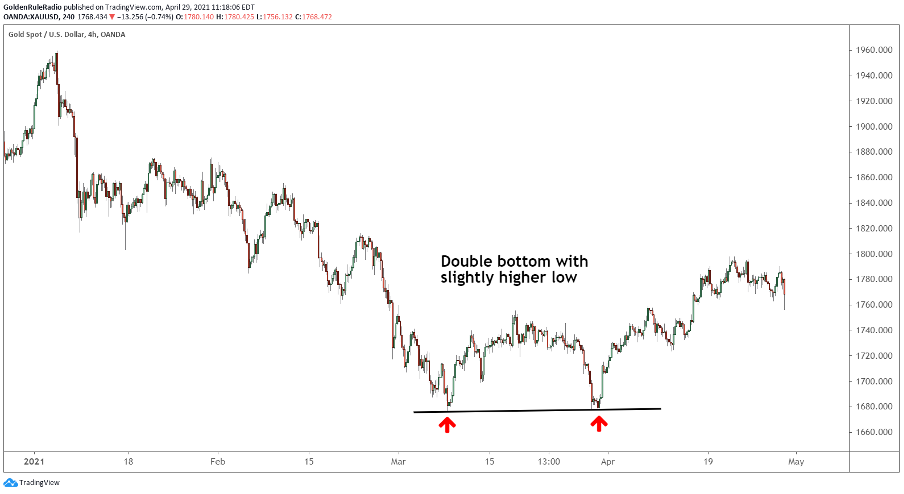
Gold’s previous rise topped out at around $1,960 at the very beginning of 2021, a couple hundred dollars below gold’s all-time high last August. The metal started a downward trend this year, which carried gold all the way to $1,678. We watched this price level like a hawk, anticipating gold would meet strong support because of coinciding Fibonacci retracement levels.
Sure enough, we saw a beautiful double bottom at that level last month, which has been holding firm ever since.
Since the double bounce, gold has risen above the .382 fib, which is the first retracement level on the way back up (and the first place you would expect to meet resistance). Gold has made some small bounces off of the .382 fib line, but has yet to climb confidently past the 50% retracement level toward the .618 fib, which lies around $1,830.
We are now looking for gold to move above the previous failure highs from mid-January. The top shelf is $1,880. If such a rise does occur, new all-time highs might not be far behind.
The U.S. Dollar Index continues to decline
The U.S. Dollar Currency Index measures the strength of the U.S. dollar relative to a basket of foreign currencies:
- Euro (EUR), weighted 58%
- Japanese yen (JPY), weighted 14%
- Pound sterling (GBP), weighted 12%
- Canadian dollar (CAD), weighted 9%
- Swedish krona (SEK), weighted 4%
- Swiss franc (CHF), weighted 4%
This index is one of the primary drivers of the gold price. Major gold markets denominate live gold prices in U.S. dollars, so the strength of the U.S. dollar has a major impact on gold demand in foreign currencies. When the dollar falls, gold becomes cheaper in other currencies.
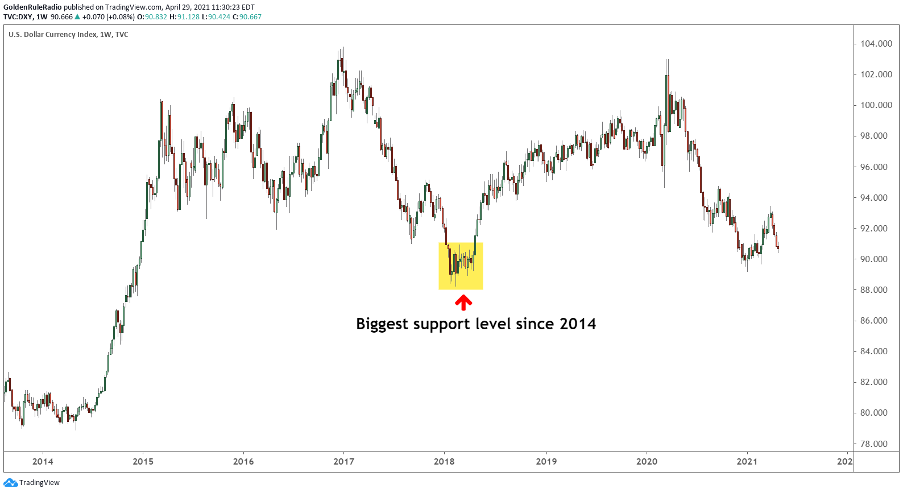
The U.S. Dollar Index had a surprisingly strong start to the year, but has lost nearly all of its 2021 gains in the last few weeks. This recent dollar weakness has been a major tailwind for the gold price, because foreign investors can purchase more dollar-denominated gold with their currency.
The index is now approaching the 89 range, which is a key support level dating back to early 2018. During the last downtrend, the dollar could not break through 89. We will be watching closely to see if the index bounces again or drops below 89 in the coming months. If we had to guess, mounting inflationary pressures in the U.S. economy will continue to rack the currency.
How should we measure the dollar?
Dollar strength is traditionally measured against the fiat currencies listed above, but does this index tell the whole story? There is one major problem with exclusively comparing a fiat currency to other fiat currencies – they ALL devalue over time.
Purchasing power often drops across all fiat currencies at once, giving false hope that individual currencies are maintaining their strength. Perhaps a more accurate way of measuring the strength of the dollar is against a basket of physical goods. Commodities more accurately show the dollar’s loss of purchasing power over time. Even better, we can measure the strength of the dollar against gold. Gold cannot lose its purchasing power and cannot be artificially inflated away.
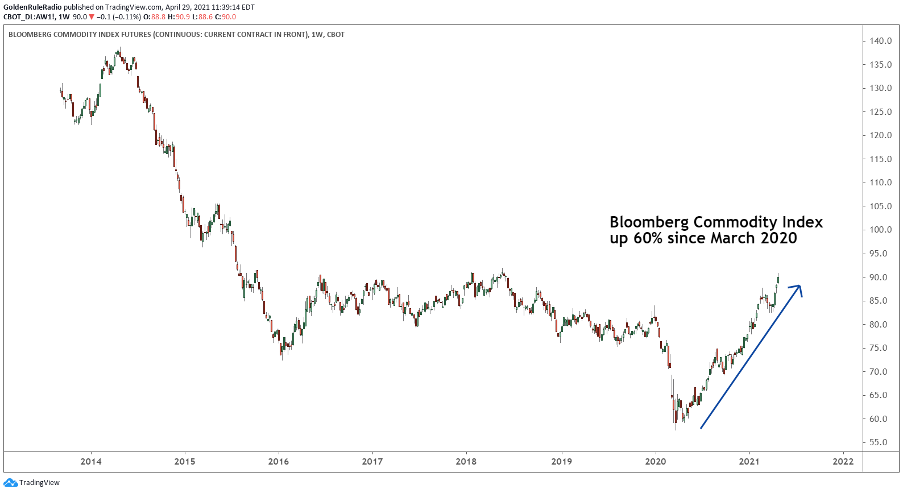
We have several ways of measuring the general price of commodities, such as the Bloomberg Commodities Index. However, it doesn’t take an experienced analyst to notice recent price increases. If you’ve been to the gas pump, purchased food at the grocery store, or heard anything about skyrocketing lumber prices, it probably comes as no surprise that the Bloomberg Commodities Index has been on the rise recently.
Commodities could break out
After holding steady between 80 and 90 for the past five years, the Index is now approaching a channel breakout. We have been talking about the possibility of a new commodity supercycle, and this could be the first major move of such a trend.
Of course, many analysts argue that the recent surge in commodity prices (and all resulting inflation) is transitory. They cite short-term supply chain issues and bottlenecks resulting from COVID-19 as the primary drivers of rising prices, which will resolve once the economy fully recovers. While this is certainly a possibility, one wonders whether the surge can possibly slow down with so much excess capital that has been injected into every major economy over the last year.
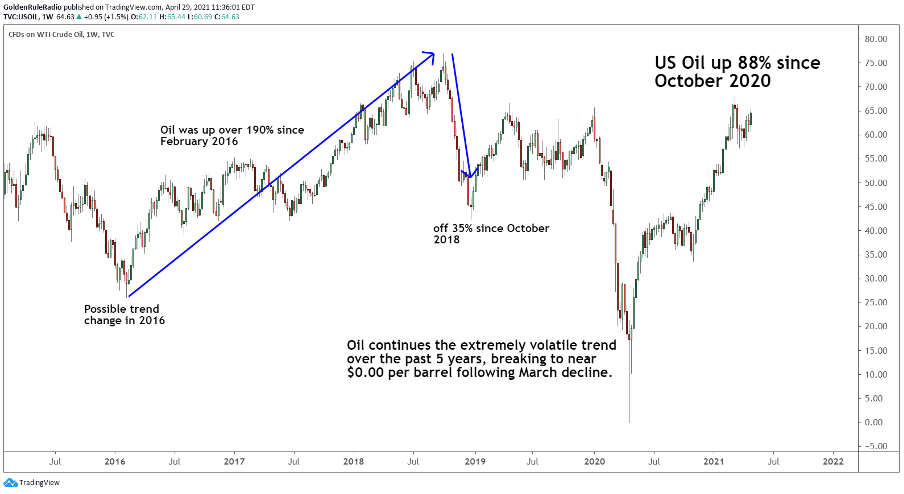
The chart below shows the extremely volatile trend of oil over the past five years. Higher gas prices put a heavy burden on your wallet, and are just one tiny sliver of the inflation story. Corn, soybean, wheat, and hog futures are all testing 8-year highs. Copper, steel, and lumber prices have reached record highs. Even coffee futures are surging.
A rising commodity index signals a weaker dollar. The question is, how much will these rising prices spill over into the life of the average citizen?
How should I react?
From 2013 to 2019, gold basically traded sideways between $1,100 and $1,300 per ounce. During these years, gold owners were generally left empty handed while the equities markets delivered incredible gains. However, after the massive breakout which began in early 2019 and lasted until last summer, long-term gold owners were heavily rewarded with a 70% price increase. This surge marks the beginning of gold’s third great bull market, and there is reason to believe gold owners’ massive rewards will continue in coming years.
The sideways movement from 2013 to 2019 is very similar to the sideways movement we saw from the early 1980’s to the early 2000’s. In the 10 years following that period of stagnation, gold embarked on a mind-boggling 600% price surge from late 1999 to its peak in mid-2011.
We believe 2013-2019 provided a base for a similarly spectacular bull market in gold. All the fundamental inflationary pressures facing the United States economy – accommodative monetary policy, ballooning budget deficits, ultra-low interest rates, record quantitative easing, rising commodities across the board – will provide the bedrock for another impressive performance from the world’s favorite yellow metal.
Vaulted is built to help investors capture these trends with the most secure and affordable platform in the industry. Login to your Vaulted account today and take control of your monetary future.
As always, happy investing!
Watch Golden Rule Radio for more of what’s in store for precious metals in 2021.


