Key Takeaways:
- A positive jobs report triggered a $130 drop-in gold last weekend. The price quickly turned back around, supported by Congress’ latest trillion-dollar spending proposals.
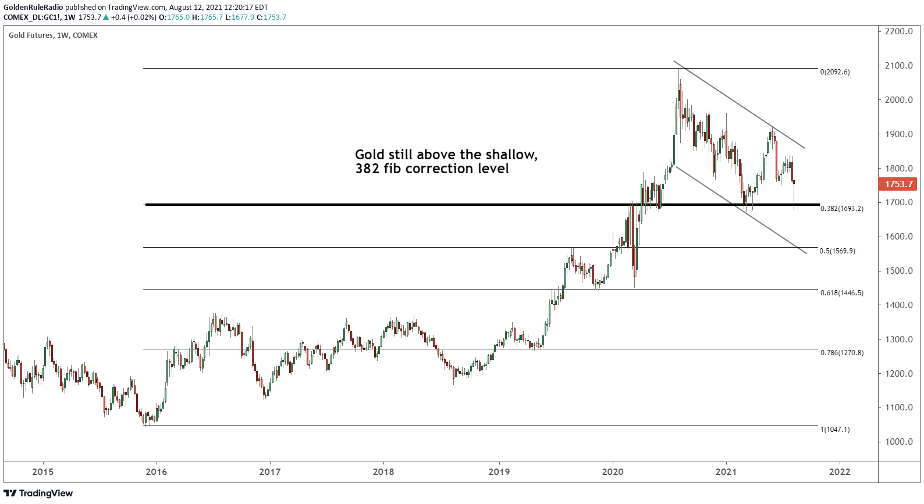
- Gold failed to break through its $1,680 floor, once again showing the strength of this support level.
- We are experiencing a short-term correction in the middle of a bull market. Looking back at other mid-bull corrections, we see that this phase has actually been quite shallow. Now is the time for investors to add to their gold position at a discount.
What caused the flash crash?
Over the weekend, gold plunged $130, adding to the $25 drop from the week earlier. Friday’s positive jobs report seemed to trigger the steep sell-off.
The non-farm payroll report measures the total number of paid workers in the U.S., excluding farm employees. Traders watch this key economic indicator closely, as it often has a large impact on currency markets. A positive payroll report indicates a stronger economy, which is negative for gold.
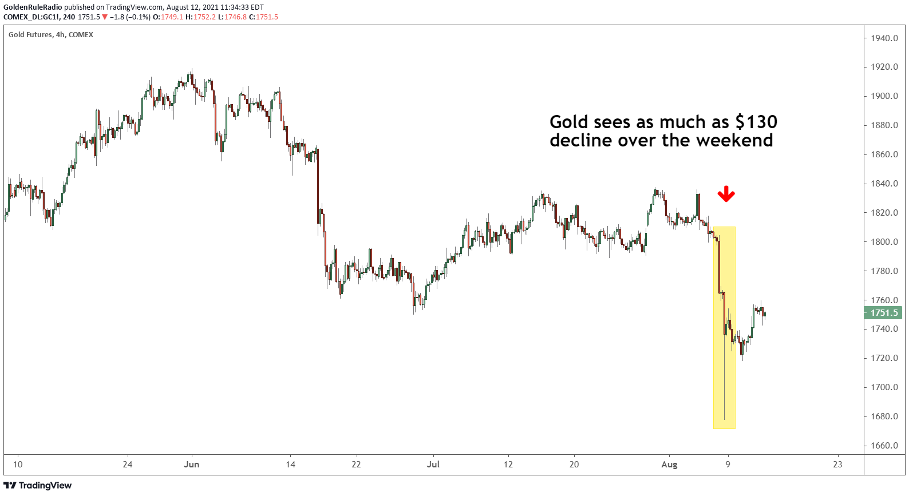
The plunge was as steep as it was short-lived. Gold immediately bounced back up to $1,750, where it has been steadily trading this week. You might expect such a sudden drop to break support, but gold failed to drop below its previous double bottom in March. The price turned around at $1,681.
The factors supporting gold
The quick turn-around can be attributed to several economic events that occurred alongside the positive jobs report. This week, Congress passed a trillion-dollar infrastructure package, and immediately announced plans for a $3.5 trillion antipoverty and climate bill. These massive spending proposals will add to the overwhelming U.S. debt, helping support the economic climate in which gold thrives.
Some prominent Democrats are fighting to replace Federal Reserve Chair Jerome Powell with a more progressive candidate. Congress is racing to raise the debt ceiling to accommodate the government’s spending, but GOP members are fighting against the decision. These economic uncertainties, both of which could lead to looser monetary and fiscal policy, are also supporting gold.
The correction phase remains shallow
$1,680 coincides with the .382 Fibonacci line going back to the beginning of gold’s most recent bull market. The .382 Fib is the most shallow level you would expect to see during a correction phase. Technically gold could travel much further and still remain in a bull market, but so far the .382 Fib has provided a stable price floor.
The bull market remains intact
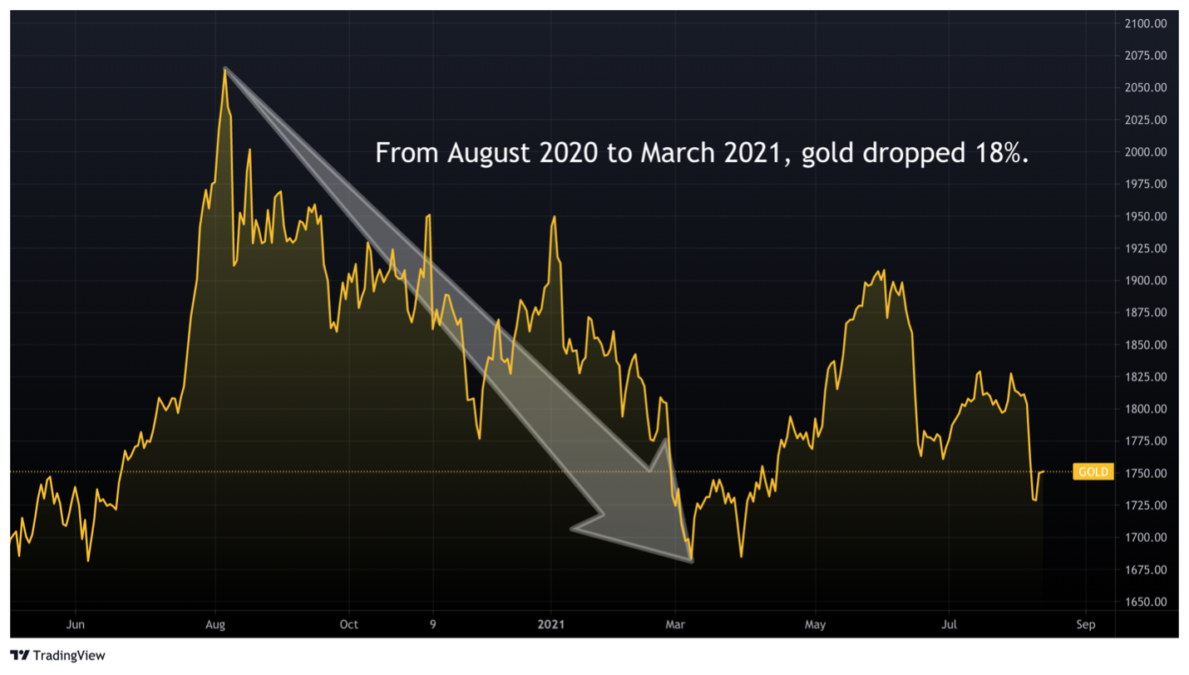
Gold started its third great bull market in 2016, when one ounce of the yellow metal was trading for $1,050. The price exploded to an all-time high of $2,100 in 2020. At that time, gold was due for a correction, which has now carried the price back down below $1,700.
From its peak in August 2020, gold has retraced approximately 18% of its value.
The correction has been difficult for gold investors, especially as all other asset classes have soared. However, it is important to remember that this is a correction in the middle of a bull market. The long-term geopolitical and economic situation has not changed. In fact, every day the economy shifts more in favor of gold’s long-term performance.
Not to mention, this correction is actually shallow compared to other corrections we have seen in the middle of previous bull markets.
The correction of 2008
For example, gold’s previous bull market began in 2001 and ended in 2011. In March of 2008, gold surpassed $1,000 for the first time in history. The bull market had already been running for 7 years, and many thought the breach of $1,000 marked the end of gold’s run.
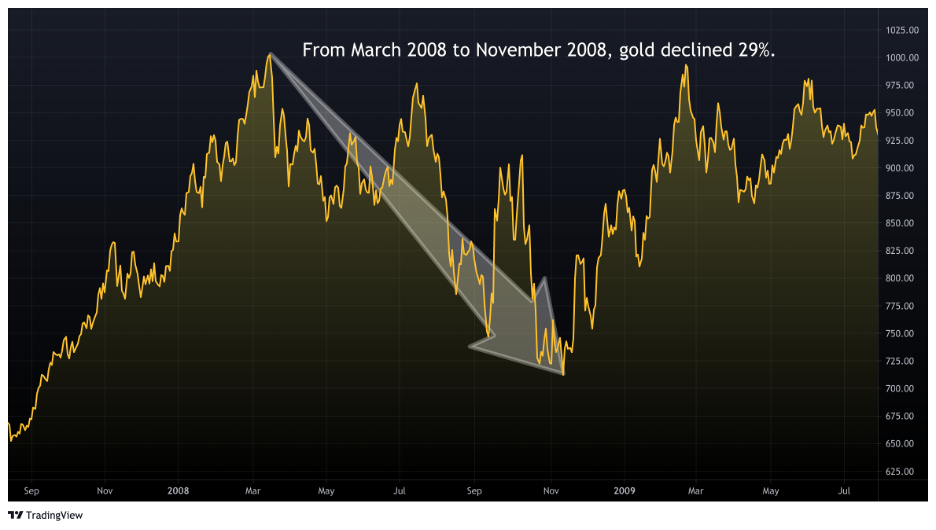
After the peak, gold declined 29%. In November of 2008, gold finally reached $709 and turned back around. It took a year and a half for gold to rise back above $1,000 and surpass its previous high.
Many investors exited their gold positions during this period because it looked like the bull market was coming to an end. Those that did missed out on gold’s epic 167% rally from 2008 to 2011, which carried the price to a high of $1,900.
1970’s corrections
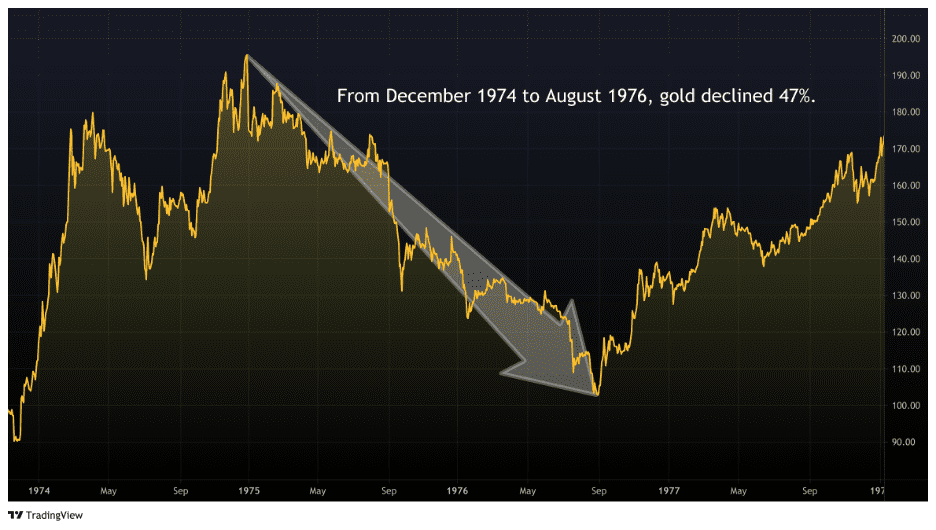
Gold also experienced several deep corrections during its first bull market that lasted from 1971 to 1980. From December 1974 to August 1976, gold lost 47% of its value (falling from $195 to $103).
In October 1978, gold plunged more than 22% in just a month.
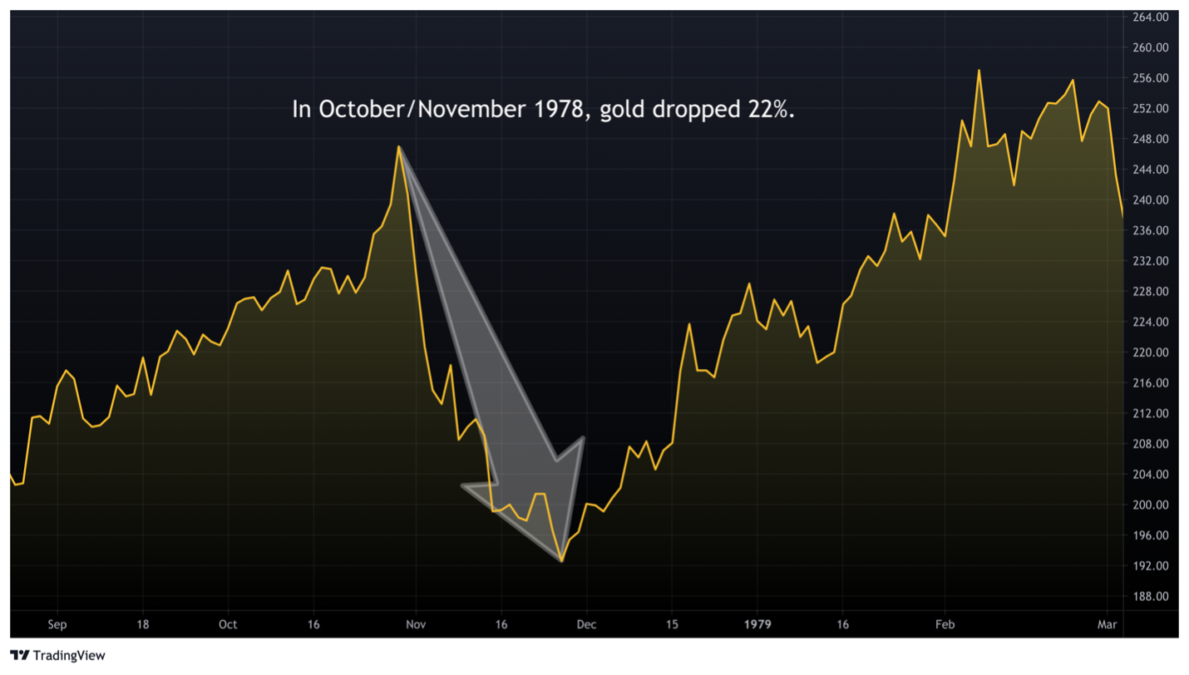
These are all examples of corrections in the middle of bull markets. Investors that trusted the fundamentals, held through these corrections, and added to their gold positions were heavily rewarded in the following years.
Of course, apples-to-apples comparisons are impossible in financial markets. However, gold investors should know that major corrections in the middle of gold bull markets are inevitable and healthy. We view the most recent correction as a buying opportunity in the middle of a clear bullish trend.
When another long-term bear market does show its face, we will be ready to exit our gold positions (and advise our clients accordingly). But now is not that time.
Secure gold savings, without the excessive fees.
Your weekly gold market commentary comes from our internal team of researchers and technical experts. Vaulted gives modern investors access to physical gold ownership at the best cost structure in the industry. With personal advising from industry experts and access to premier precious metals strategies, Vaulted is the key to life-long financial prosperity. Start protecting your portfolio today.
As always, thank you so much for reading – and happy investing!
Watch Golden Rule Radio for more of what’s in store for precious metals in 2021.