By examining gold price data, we can see how gold has preserved and grown wealth through economic cycles, inflation, wars, and changing political regimes.
Gold performs well during inflection points, which explains its appeal in a modern portfolio.
To track gold’s performance in real time, check the current gold price here.
100-Year Gold Price History
Gold Prices by Decade
| Decade High | Decade Low | Closing Price | Average Price | % Change | |
| 1925-34 | 35.00 | 20.75 | 35.00 | 22.93 | 68.7% |
| 1935-44 | 35.00 | 35.00 | 35.00 | 35.00 | 0.0% |
| 1945-54 | 35.00 | 35.00 | 35.00 | 35.00 | 0.0% |
| 1955-64 | 35.00 | 35.00 | 35.00 | 35.00 | 0.0% |
| 1965-74 | 195.50 | 35.00 | 186.75 | 58.44 | 433.6% |
| 1975-84 | 875.00 | 100.00 | 307.90 | 316.87 | 64.9% |
| 1985-94 | 502.30 | 281.20 | 383.10 | 378.52 | 24.4% |
| 1995-2004 | 456.70 | 252.10 | 438.00 | 331.50 | 14.3% |
| 2005-14 | 1,920.94 | 410.50 | 1,184.02 | 1,076.24 | 170.3% |
| 2015-24 | 2,790.07 | 1,046.54 | 2,624.16 | 1,605.81 | 121.6% |
As of January 2026, gold had peaked at $5,598/oz. Check the current gold price here.
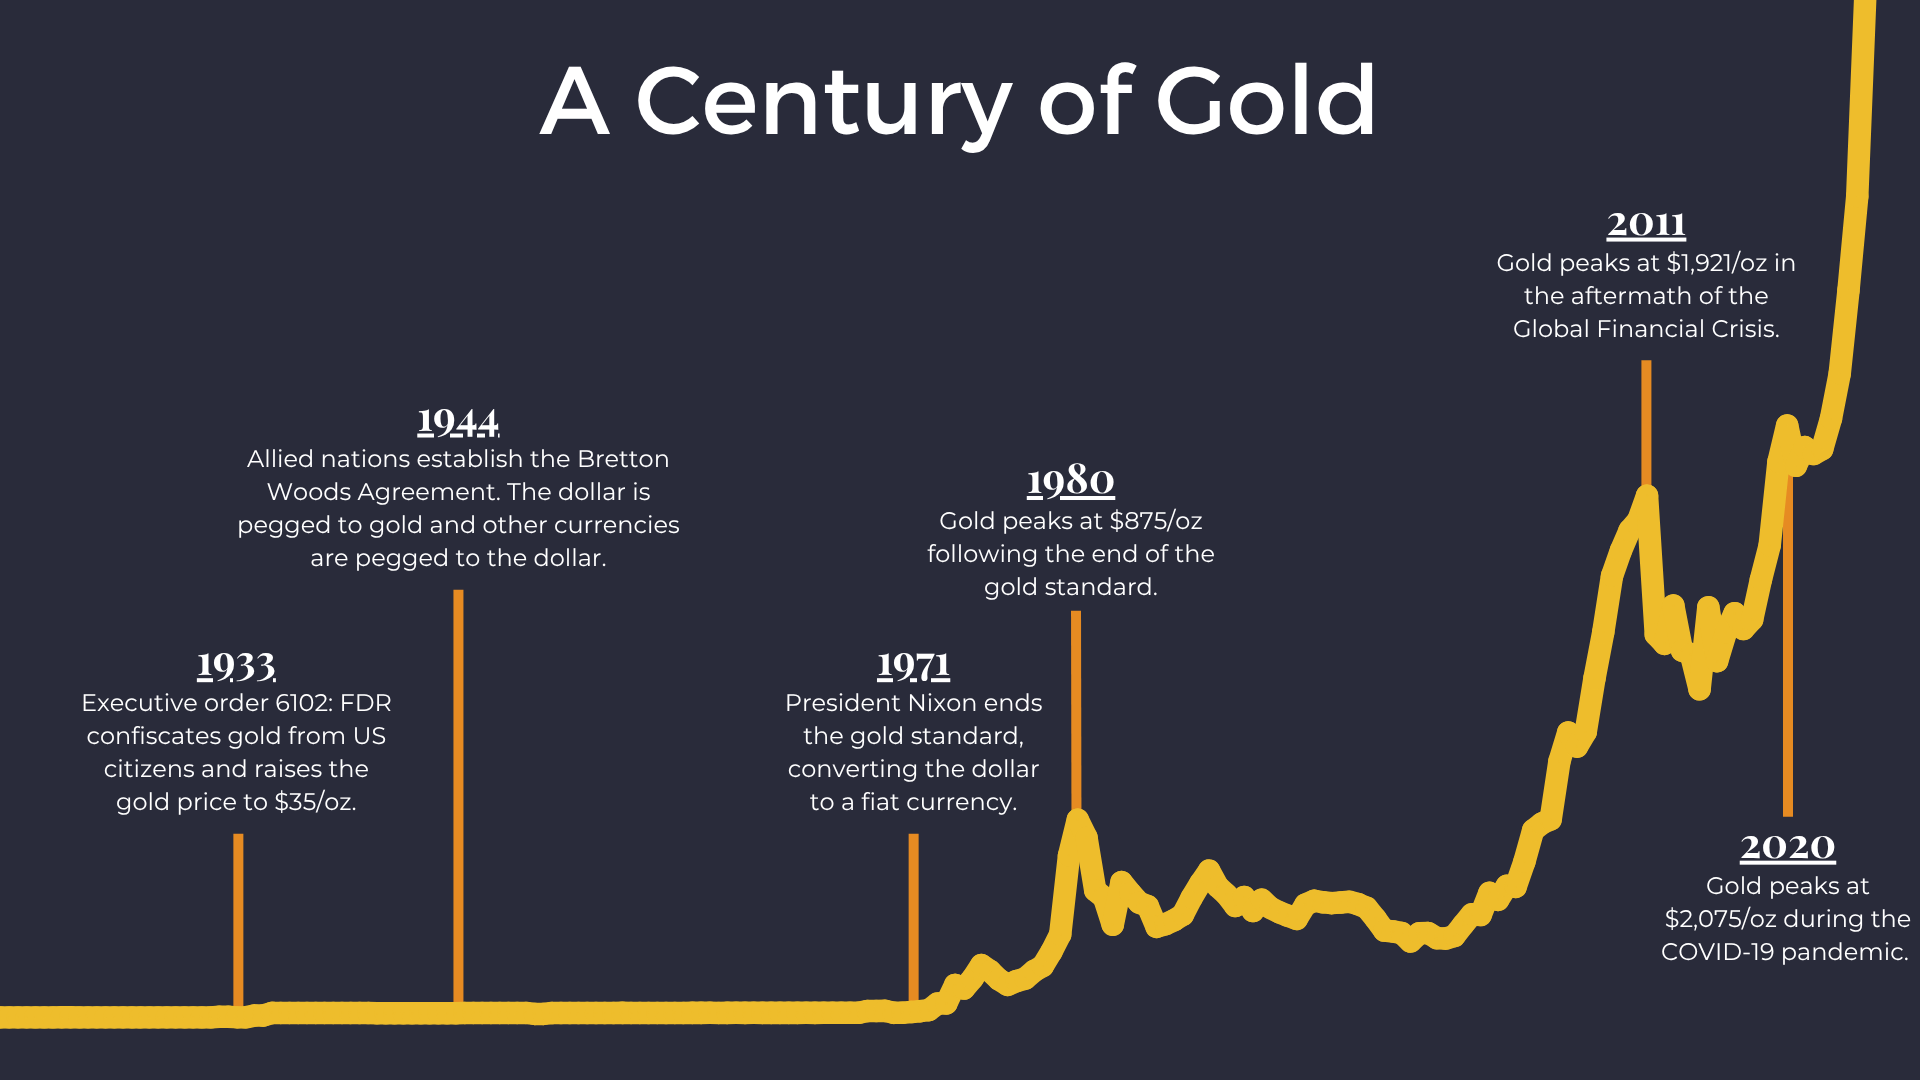
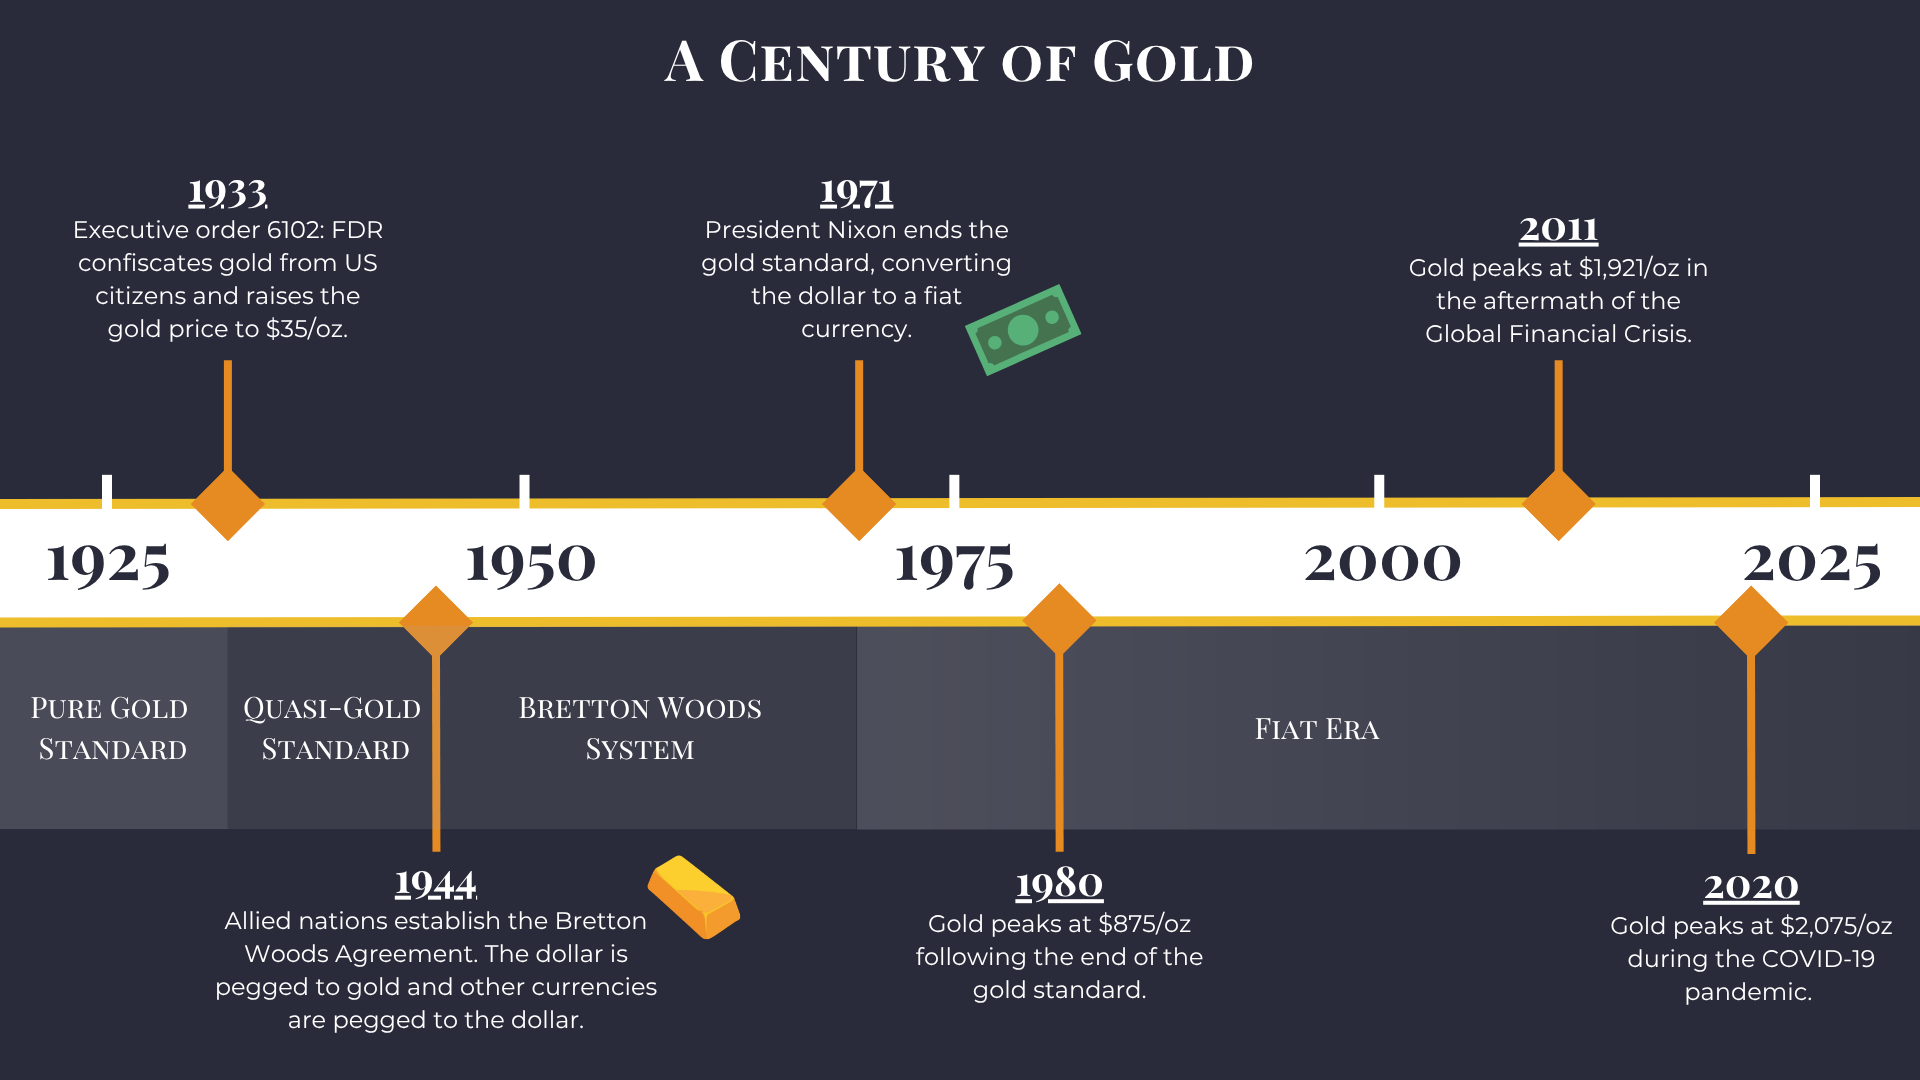
A Century of Gold: 1925 to Present
Over the past century, gold’s price history can be divided into four eras:
- Classical Gold Standard (pre-1933)
- Quasi-Gold Standard (1933-1944)
- Bretton Woods System (1944-1971)
- Fiat Era (1971 to present)
In each era, gold had a different relationship with the U.S. dollar.
Classical Gold Standard (Pre-1933)
One hundred years ago, the dollar was literally a substitute for a specific weight of physical gold: 0.04838 troy ounces to be exact (which equates to $20.67 per ounce).
When currencies were directly convertible into gold, gold’s price stayed very stable. After the U.S. Treasury fixed the price of gold at $20.67 in 1834, that price held for nearly 100 years.
Other governments around the world also had their currencies pegged to gold during this era. Sir Isaac Newton himself set the British gold price in 1717.
The Great Depression put an end to the classical gold standard. In 1933, facing bank runs and deflation, U.S. President Franklin D. Roosevelt outlawed private gold ownership and required U.S. citizens to turn in their gold coins and bullion to the Federal Reserve.
He then devalued the dollar by raising the official gold price to $35 per ounce, amounting to a 69% increase in the price of gold.
Quasi-Gold Standard (1933-1944)
We call it the “quasi-gold standard” because gold still technically backed the U.S. dollar, but private citizens could no longer redeem their paper money for gold from the U.S. Treasury.
However, foreign governments still could. Central banks managed exchange rates between currencies by converting fiat to gold and vice versa.
Bretton Woods System (1944–1971)
After WWII, the U.S. held over 70% of the world’s gold. In 1944, the Allied nations established the Bretton Woods Agreement, in which the U.S. dollar was pegged to gold at $35/oz and other allied currencies were in turn pegged to the dollar.
This period saw relative price stability, although the $35 peg came under pressure when the U.S. government sharply increased spending and expanded the money supply in the 1960s.
As inflation rose and deficits increased, other countries (especially France under President Charles de Gaulle) began sending ships to the United States to exchange their dollar reserves for physical gold. U.S. gold reserves quickly depleted, making the $35 price unsustainable.
In 1968, a two-tier market emerged: the “official” $35 price and a market price. In August 1971, President Richard Nixon “closed the gold window,” ending the Bretton Woods system and completely severing the dollar’s convertibility to gold.
Fiat Era (1971–Present)
Once gold was allowed to trade freely in the 1970s, its price quickly soared to find a market equilibrium. Pent-up demand and high inflation in the 1970s sent gold to a peak of $850/oz in January 1980. Geopolitical tensions, such as the Iran hostage crisis and Soviet invasion of Afghanistan, helped drive gold higher.
As inflation was tamed in the 1980s, gold entered a long bear market. Under Paul Volcker, the Fed cranked up interest rates and strengthened the U.S. dollar. Gold prices fell to $295/oz and then flatlined. By 1999, gold hit a low of $252/oz.
Gold’s fortune reversed in the 21st century.
Here is a closer look at the last 30 years of gold prices:
30-Year Gold Price History
Gold Price Trends: Last 30 Years (1996–2025)
Late 1990s: “The Death of Gold”
The late 1990s featured strong global economic growth, low inflation, and soaring technology stocks as investors placed optimistic bets on the future of the internet.
In December 1997, the Financial Times published an article titled “The Death of Gold.” Central banks were on a gold selling spree. Most famously, the United Kingdom sold off half of its gold reserves – 395 tonnes – beginning in 1999 (bad timing, to say the least).
Early 2000s: Rising Demand and Prices
When the dot-com bubble burst in 2000 and triggered a recession, gold re-entered the spotlight. The September 11th attacks in 2001 also jolted safe haven demand, kicking off a decade-long bull market.
The Federal Reserve sliced the Federal Funds rate from 6.5% in 2000 to just 1% in 2003. Interest rates across the economy fell, reducing returns from traditional investments. As a result of loose monetary policy, the U.S. dollar weakened significantly against other currencies.
These factors fueled gold’s rise from $254/oz in 2001 to $844/oz in 2007.
Global Financial Crisis (2008-2011): Historic Highs
In response to the Global Financial Crisis, the Federal Reserve (and other central banks) implemented monetary policies the world had never seen before, including:
- Near-zero interest rates to encourage borrowing and spending
- Quantitative easing (QE)—massive purchases of government bonds and other securities to inject liquidity into the financial system
- Bailouts for major banks deemed “too big to fail”
These events triggered a gold-buying frenzy. Economists had long warned about the consequences of loose monetary policy, which had triggered hyperinflation and unsustainable economic booms many times in the past.
Gold prices peaked at $1,921/oz in 2011.
Overall, gold increased by 659% during the 2000 to 2011 bull market.
Post-GFC Consolidation (2012-2015)
As economic growth improved, retail demand for safe-haven investments dwindled. Gold prices saw significant corrections, stabilizing around $1,200/oz. The Federal Reserve gradually reduced monetary stimulus, strengthening the dollar and putting downward pressure on gold prices.
This brings us to the last decade, which has seen another massive bull market in gold:
10-Year Gold Price History
Gold Price Trends: Last 10 Years (2016–2025)
2016: Gold kicked off its third great bull market as stock market corrections and Brexit drove safe-haven demand.
2017: Despite solid global economic growth and rising stock markets, gold saw support from a weakening U.S. dollar, ending the year up 14.6%.
2018: Gold faced headwinds from Federal Reserve rate hikes and a strong dollar for most of the year, though late-2018 stock market correction triggered a flight to safety that buoyed gold prices.
2019: The U.S.-China trade war prompted the Fed to pivot and cut rates, weakening the dollar and boosting gold. In December, gold spiked to $1,611/oz as investors anticipated looser monetary policy, ending the year up 21.2%.
2020: Prices surged to a record high above $2,075 in August 2020 as investors piled into safe-haven assets during COVID-19 pandemic shutdowns and massive central bank stimulus. Gold finished the year at $1,848.4/oz.
2021: Gold plateaued with a $1,800/oz average. The economy rebounded, but the highest inflation in decades provided support for gold.
2022: Gold spiked to $2,070 in March 2022 after Russia’s invasion of Ukraine. Central banks purchased a record 1,080 tonnes of gold in 2022. However, aggressive Federal Reserve rate hikes strengthened the dollar and created headwinds. By year-end, gold was up 2%, closing at $1,865.05.
2023: Gold spiked to a new high in March 2023 when several U.S. banks (most notably Silicon Valley Bank) collapsed after rapid rate hikes destroyed their bond portfolios. As central banks continued record gold buying, gold reached another high of $2,147/oz in December.
2024: In the first half 2024, a mix of persistent inflation, wars in the Middle East and Ukraine, a weakening dollar, and falling interest rates pushed gold higher. Even as the dollar and interest rates climbed around the presidential election, gold continued to perform, ending the year at $2,690 – up 31%.
2025: Central banks continue to buy physical gold at a record pace to diversify away from their U.S. Treasury reserves (a trend known as de-dollarization). Trump’s tariffs have also stoked demand, helping push gold to an unprecedented $3,500/oz in April 2025.
What Drives Gold Prices?
Gold’s price is determined by marginal buyers and sellers on the open market. When the gold price rises or falls, it is always the result of shifting supply and demand.
For more information, check out the latest research from the World Gold Council. CME Group also provides great resources on both gold and silver.
There are several important factors that encourage people to buy and sell gold, including:
-
- Interest rates
- Inflation expectations
- The strength of the US dollar
- Industrial/jewelry demand
- Central bank gold purchases
- Geopolitical and economic crises
- Costs to mine gold
To better understand these factors, check out this article: What Makes the Gold Price Rise and Fall?
Historical Outlook on Gold Prices
Gold has demonstrated an extraordinary ability to preserve wealth and offer protection during turbulent times. Looking back on not only the last 100 years of gold prices, but the last 5,000, we see a metal that has remained synonymous with “treasure” though wars, inflationary spirals, financial crashes, and shifting political regimes.
Even adjusting for inflation, gold’s real value has trended upward over the decades. In the past few years, we’ve seen record levels of private investment and central bank gold purchases (over 1,000 tonnes per year).
Individual investors and entire nations rightly view gold as a strategic asset in today’s era of geopolitical tension. Gold’s performance over the last 10 years reinforces its unique role as a safe haven when stocks, bonds, and other assets come under pressure.
To track gold’s performance in real time, check the current gold price here.