The gold/oil ratio does much more than just compare commodity prices. It reflects how the market values the world’s top monetary asset (gold) versus the world’s top productive asset (oil).
When the economy hits a turning point, the gold/oil ratio rises. When the economy stabilizes and productive output becomes predictable, the gold/oil ratio falls.
Why Are Gold and Oil Connected?
Gold and oil both have a special relationship with inflation.
- Oil drives inflation. We need energy to produce and transport everything – food, cars, electronics, building materials. Because oil is a key input in nearly every industry, rising oil prices ripple across the entire economy.
- Gold responds to inflation. Investors flock to gold when inflation expectations rise or when confidence in fiat currencies falls.
Gold and oil also respond to many of the same macroeconomic factors:
- Geopolitical Risk: Conflicts in oil-rich regions like the Middle East disrupt oil supplies and raise prices. Those same events trigger safe-haven demand for gold.
- Dollar Strength: Since both are priced in U.S. dollars, a weaker dollar tends to push their prices higher, and vice versa.
For these reasons, gold and oil tend to be roughly correlated over the long run.
Here is a chart of gold and oil prices since the end of the U.S. gold standard in 1971:
The real insight comes not when gold and oil move together, but when they diverge. To track this, we need the gold/oil ratio.
What Is the Gold/Oil Ratio?
The gold/oil ratio measures how many barrels of oil one ounce of gold can buy.
Gold Price (per oz) ÷ Oil Price (per barrel) = Gold/Oil Ratio
Historically, this ratio has hovered around 15, meaning one ounce of gold can buy 15 barrels of oil.
A high gold/oil ratio (25 or more) suggests oil is cheap relative to gold.
A low gold/oil ratio (10 or less) suggests oil is expensive relative to gold.
Gold/Oil Ratio Historical Chart
What Does the Gold/Oil Ratio Tell Us?
The gold/oil ratio represents the tug-of-war between Wall Street (the world of finance) and Main Street (the real economy).
Gold is a monetary asset. It doesn’t fuel factories or power cars. People buy it when they expect a major change in how the economy functions. Gold provides store of value when the future is uncertain because of currency devaluation, high debt levels, excessive government spending, and geopolitical regime changes. Monetary assets are the place to be during turning points.
Oil, on the other hand, is a productive asset. It powers transportation, manufacturing, and agriculture. Rising oil prices signal strong demand (factories are humming, planes are flying, consumers are spending). So, oil reflects what’s happening in the real-world economy. Productive assets are the place to be when the economy is stable and predictable.
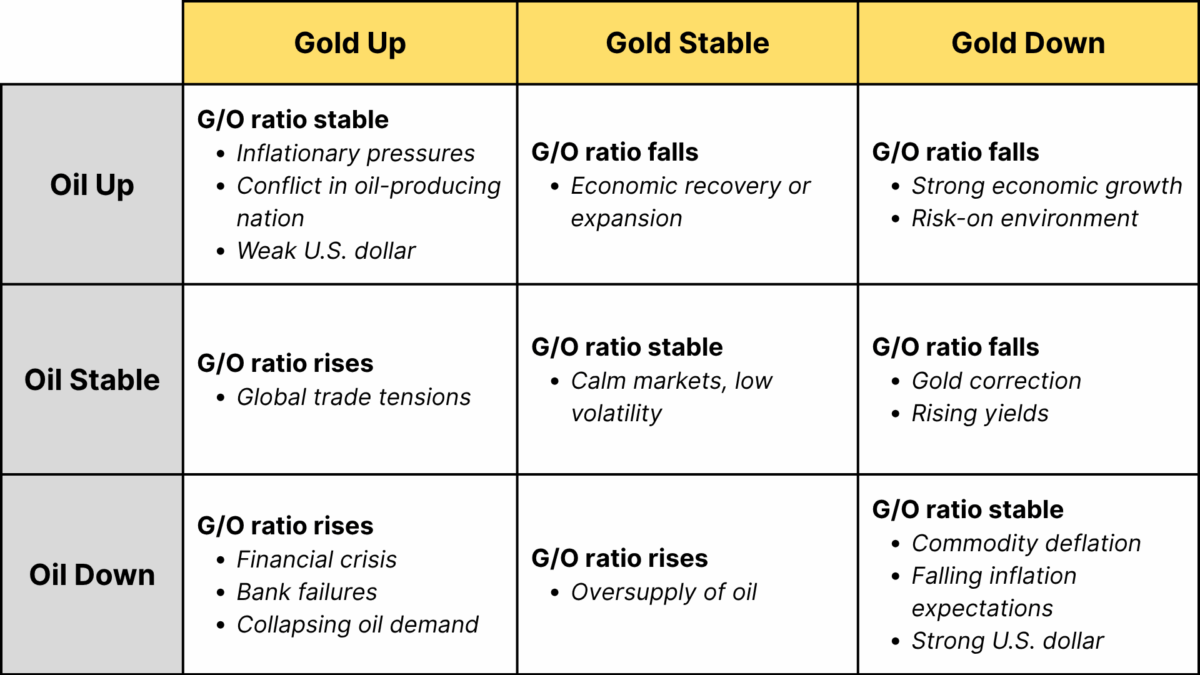
When the gold/oil ratio is steady, it means financial markets and the real economy are in sync. But when the ratio swings sharply, things get interesting.
Rising gold/oil ratio:
- Gold is outperforming oil. Oil is relatively cheap.
- The economy has reached a turning point. Growth is uncertain. The ratio is saying “from now on, things are going to be different.”
- Capital is moving to monetary assets (gold) rather than productive assets (oil).
- Usually signals a “flight to safety” during a financial crisis. May also indicate collapsing oil demand or a supply glut.
Examples: COVID crash in 2020, Global Financial Crisis in 2008, Oil supply glut in 2014-16, end of the U.S. gold standard in 1971
Falling gold/oil ratio:
- Oil is outperforming gold. Oil is relatively expensive.
- The economy has settled into a status quo. The ratio is saying “the economy is secure and future productive output will be stable.”
- Capital is moving to productive assets (oil) rather than monetary assets (gold).
- Indicates strong economic activity, optimism, and rising demand for energy. May also signal an oil supply crunch.
Examples: Stock bubble of the late 1990’s, Oil boom of 2003-05, Economic recovery from 2011-13
Gold/Oil Ratio History
Below are all the major peaks and troughs in the gold/oil ratio in modern history.
Dec 1970 to June 1973 (End of the Gold Standard): Rose from 10.5 to 35.5
- President Nixon ended the U.S. dollar’s convertibility into gold in August 1971. Inflation was climbing due to loose monetary policy and excessive government spending. At the time, oil prices were fixed by major oil companies and the U.S. government at around $2.50 per barrel. Gold prices surged while oil remained stable, pushing the ratio higher.
June 1973 to Jan 1974 (Oil Crisis): Fell from 35.5 to 11.1
- Following the Yom Kippur War, OPEC imposed an oil embargo on the U.S. and other Western nations. Oil prices rose from $3.50 to $10 per barrel, collapsing the ratio.
Nov 1985 to April 1986: Rose from 10.2 to 33.6
- Oil prices crashed due to a price war among OPEC members and increasing oil supplies from elsewhere. Gold held steady, so the ratio spiked.
July 1990 to Oct 1990 (Gulf War): Fell from 22.5 to 9.3
- Iraq invaded Kuwait, causing panic in oil markets. Oil prices spiked. Gold rose too, but much more modestly. The surge in oil caused the ratio to collapse.
Oct 1990 to Dec 1993: Rose from 9.3 to 28.3
- After the Gulf War, oil supply stabilized and prices fell rapidly.
Dec 1998 to Nov 2000: Fell from 27.5 to 7.4
- Oil demand rebounded sharply after the Asian Financial Crisis. At the same time, gold was stuck in a bear market as investors turned to technology stocks and central banks sold their gold reserves. Oil soared, gold stayed flat.
Nov 2000 to Jan 2002 (Dot-Com Crash): Rose from 7.4 to 16.0
- Gold regained safe-haven appeal during the dot-com crash and U.S. recession. Oil prices dropped as global oil demand decreased.
Sep 2003 to Aug 2005 (Oil Boom): Fell from 14.2 to 6.2
- China’s industrial demand soared, and the Iraq War disrupted oil supply. Oil prices climbed steadily. Gold rose too, but more slowly.
June 2008 to Feb 2009 (Global Financial Crisis): Rose from 6.3 to 28.4
- Oil crashed as economic activity collapsed. Gold surged on financial panic and deflation fears.
Aug 2011 to July 2013: Fell from 22.9 to 11.8
- Gold peaked at $1,920 mid-2011 during the U.S. debt ceiling crisis. Gold entered a bear market as inflation fears faded and the economy recovered. Oil prices also fell slightly, but not as much as gold.
May 2014 to Feb 2016 (Oil price collapse): Rose from 12.1 to 46.0
- U.S. shale production surged. OPEC didn’t cut production, leading to a supply glut. Oil prices dropped from $105 to $26 per barrel. Gold held relatively stable, so the ratio exploded.
Feb 2016 to Oct 2018: Fell from 46.0 to 15.7
- OPEC+ implemented production cuts and oil rebounded. Global economic growth picked up. Gold faced headwinds from a strong dollar and rising interest rates.
Dec 2019 to Apr 2020 (COVID-19 pandemic): Rose from 23.9 to 89.2
- Oil demand collapsed. WTI crude briefly went negative in April 2020, so the gold/oil ratio actually broke. The closing value was at the end of April was 89.2, twice as high as previous peaks. Gold soared on fears of economic collapse and massive stimulus.
Apr 2020 to June 2022: 89.2 to 14.8
- Oil prices recovered sharply as demand returned. OPEC+ kept supply tight. Gold corrected slightly as risk appetite returned and interest rates rose.
June 2022 to May 2025: Rose from 14.8 to 58.5
- Ongoing deglobalization, U.S. tariffs, and conflicts in the Middle East and Ukraine created strong safe-haven demand for gold. Central banks purchased physical gold at a record pace. Oil struggled due to slowing global growth. The result: gold surged, oil lagged.