Money Supply Growth
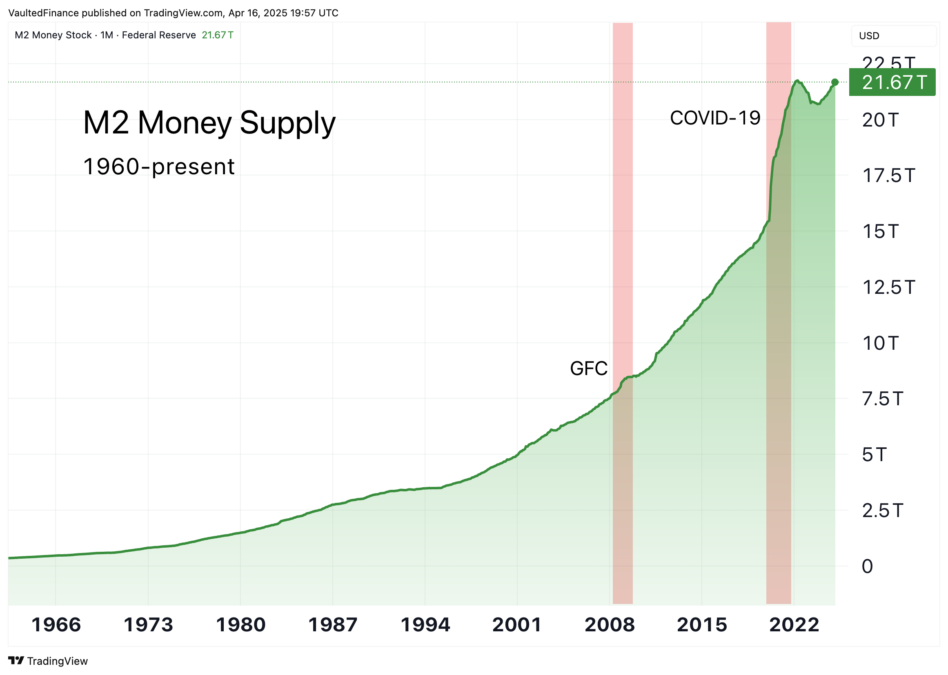
Since the early 2000s, the global money supply has grown at a staggering pace. Trillions of dollars have been created to stimulate the economy, backstop collapsing banks, and fund massive government spending during COVID-19.
“Money supply” refers to the total amount of money in an economy. Because there are different definitions of money, economists can calculate the money supply in different ways.
M2 tracks cash, checking deposits, savings deposits, and money market funds. These forms of money are all very liquid, which means they can easily be converted to spendable currency.
The exponential growth of M2 has contributed to an exponential increase in the prices of goods and services. Money supply growth inevitably causes devaluation of the nation’s currency.
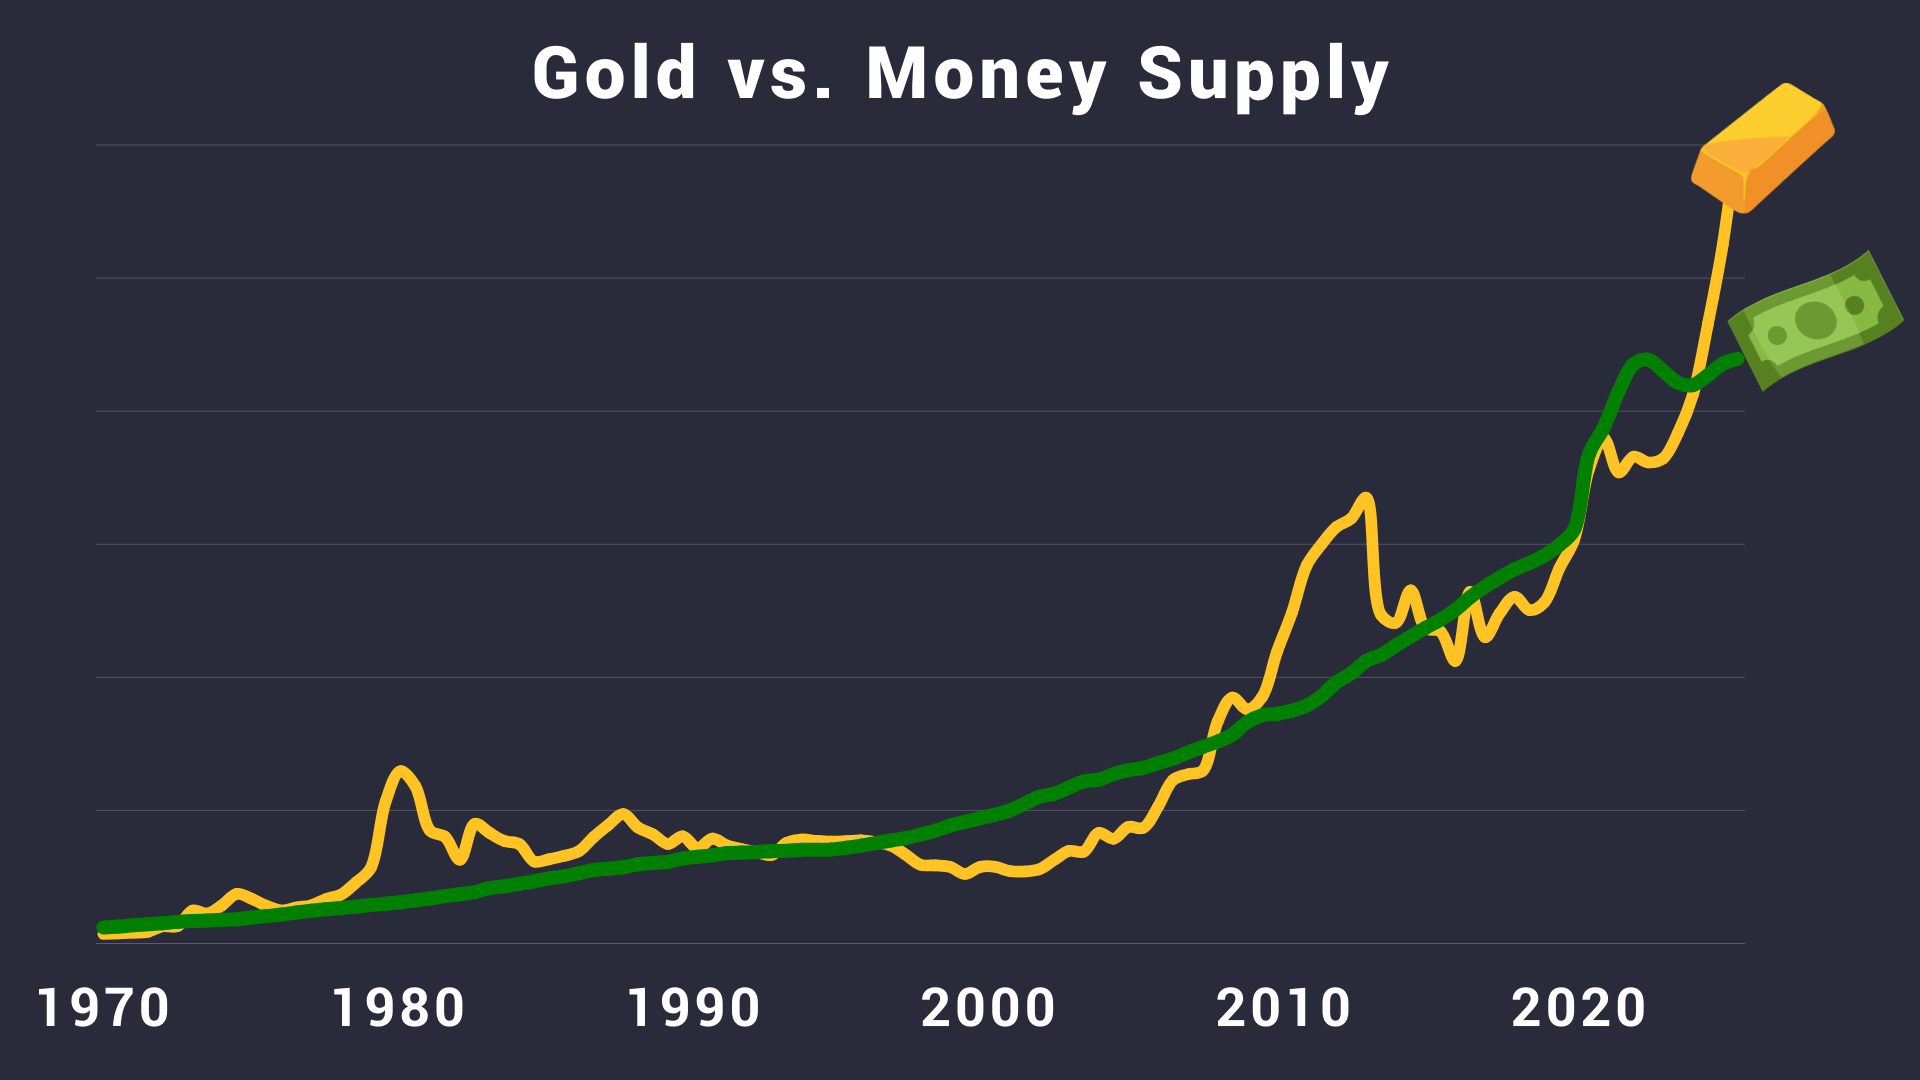
Gold vs. Money Supply
This monetary expansion wasn’t always possible. For most of US history, the U.S. dollar (and other major currencies) were pegged to gold at a fixed exchange rate. Central banks had to hold enough gold in their vaults to back their currency, which placed a strict limit on money printing.
In 1971, President Nixon ended the gold standard. Today, all major currencies are “fiat” which means they are backed only the issuing government rather than a physical commodity.
However, gold’s relationship with money is as strong as ever. We can see this demonstrated in gold’s performance against the money supply. This chart shows the price of gold alongside M2:
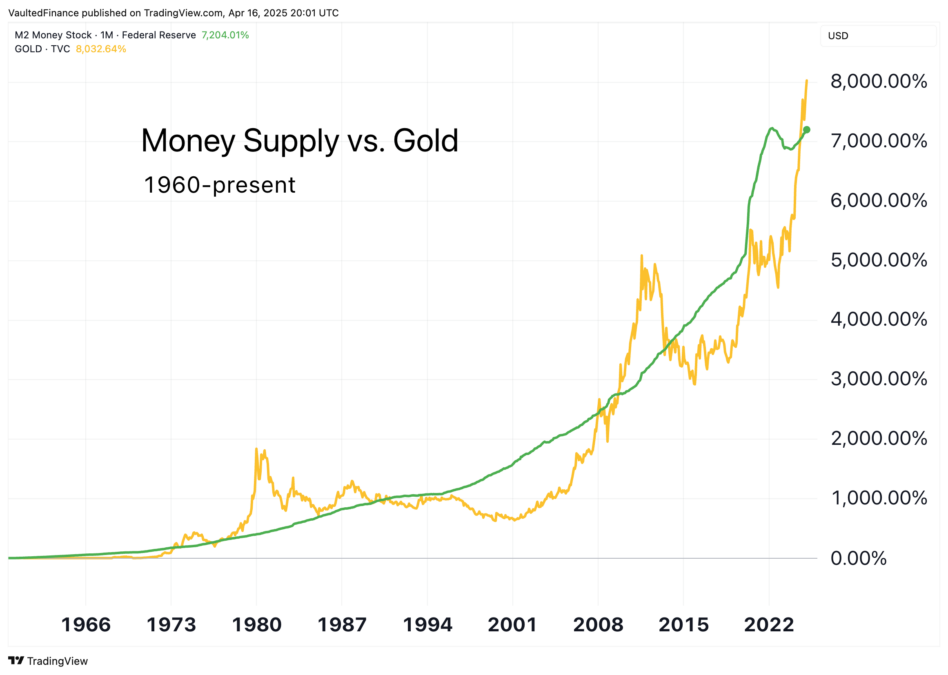
The gold price tracks money supply growth.
For that reason, the last 50 years have seen exponential returns in gold. Fortunately for gold investors, the parabolic growth of the money supply is unlikely to end anytime soon.
When trying to understand the relationship between gold and money supply, analysts typically focus on U.S. economic data for two reasons: 1) the dollar is the global reserve currency, and 2) gold is priced in U.S. dollars on most global exchanges.
This relationship extends to the global money supply as well. According to the World Gold Council, gold has reliably tracked global money supply growth for the last 50 years, and even outpaced Treasury bills.
Gold as a Store of Value
Under the gold standard, money served three vital roles: 1) a medium of exchange 2) a store of value, and 3) a common baseline to compare prices of goods and services.
Fiat currencies struggle to serve the latter two purposes. By radically increasing the supply of fiat currencies on a regular basis, governments undermine their intrinsic value. The longer an investor holds onto his dollar bills, the poorer he gets.
In fact, since the creation of the Federal Reserve in 1912, the U.S. dollar has lost nearly 98% of its purchasing power. The gold price, on the other hand, has multiplied a hundredfold. This may seem like a lot, but gold has really just maintained its purchasing power. Today, one ounce of gold purchases approximately the same goods and services it did 100 years ago.
We have evidence that gold has maintained its purchasing power not just over the last century, but over thousands of years:
- Ancient Mesopotamia: Hammurabi’s Code (1750 BC) sets the price of a surgery by a physician at 10 shekels (~3 oz of silver), which equated to ~0.31 oz of gold. Healing a broken bone was worth 5 shekels, or 0.16 oz of gold. These rates are surprisingly similar to today’s cash-pay rates for simple procedures.
- Ancient Rome: During the reign of Emperor Augustus (27 B.C. to 14 A.D.), a Roman centurion earned an annual salary of approximately 3,500 denarii, which equated to 36 ounces of gold. The closest modern comparison to a Roman centurion might be a U.S. Army Sergeant with an enlisted pay grade of E-6 to E-9, who earns an annual salary equivalent to, you guessed it, 36 ounces of gold.
- 14th Century England: A knight banneret (a military rank designating a knight who led troops under his own banner) earned an annual income of 60–100 pounds sterling, which equated to 24–40 ounces of gold (₤1 was worth 0.3–0.5 ounces of gold). Compare this to the annual earnings of King Edward III (~£50,000 or ~20,000 gold oz) and an average skilled laborer (just ~£6 or ~2.4 gold oz).
Gold/Money Supply Ratio
If we divide the price of gold by M2 money supply, we get the gold/M2 ratio. This ratio shows us the value of one ounce of gold relative to M2 money supply. When the ratio is low, gold is undervalued relative to M2, and vice versa.
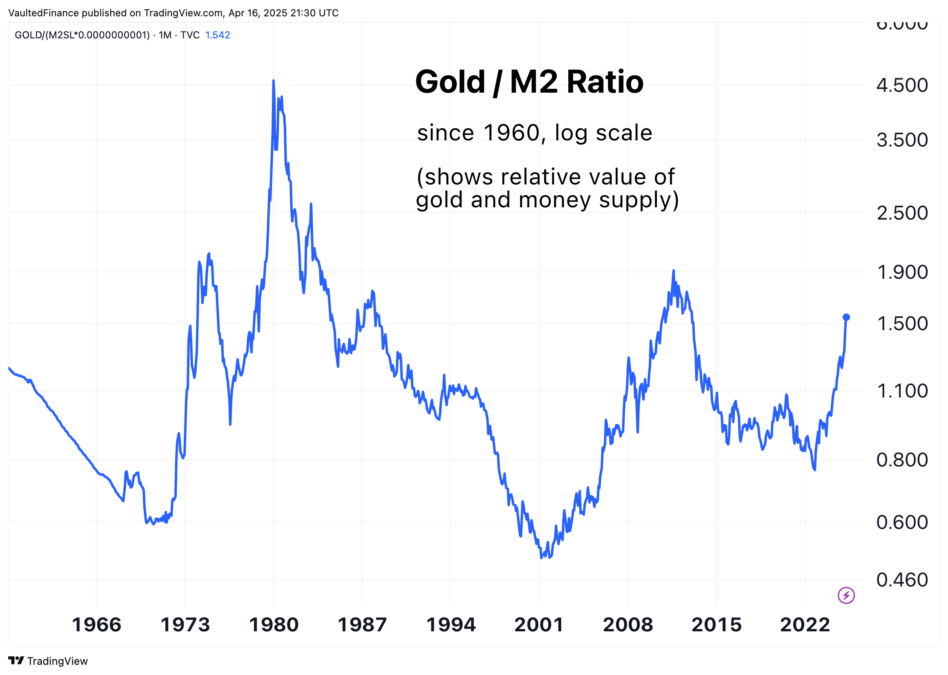
As you can see on the chart above, gold bull markets tend to correlate with large increases in the ratio (1971-1980, 2000-2011). In other words, gold bull markets tend to outperform money supply growth.
There is no guarantee gold price will follow money supply in the short run. However, over the long run, gold always finds its way back to its historical baseline. In that sense, gold preserves value better than any other financial asset.
Protecting Purchasing Power
Money should be a neutral reserve asset, not someone else’s debt. Every major economy now functions on fiat currency, which has no intrinsic value. Without the backing of gold, nations can print money to their hearts’ content, and print they do.
Gold is one of the reliable hedges against long-term currency devaluation.
Parabolic growth in global debt levels and money supply will continue to push investors toward the world’s oldest and most trusted currency. The massive increase in the price of gold reflects devaluation of everything else.